Dashboards
Use the dashboard area, My Support Work, and Dove365 Support Dashboard to monitor workload.
Purpose
Dove365 Support includes dashboards for personal work management and organisation-wide support operations.
Dashboard area
Dashboards are accessed inside the Dove365 Support model-driven app.
The main dashboards and boards are:
- Dove365 Support Dashboard — organisation-wide operational reporting.
- Dove365 My Support Work Dashboard — a personal view for the signed-in user.
- Dove365 Kanban Board — queue work grouped by support state.
- Dove365 Queue Workload Board — queue work grouped by who is carrying the load.
All four must be opened inside the Dove365 Support model-driven app so they can reach Dataverse and the current user context.
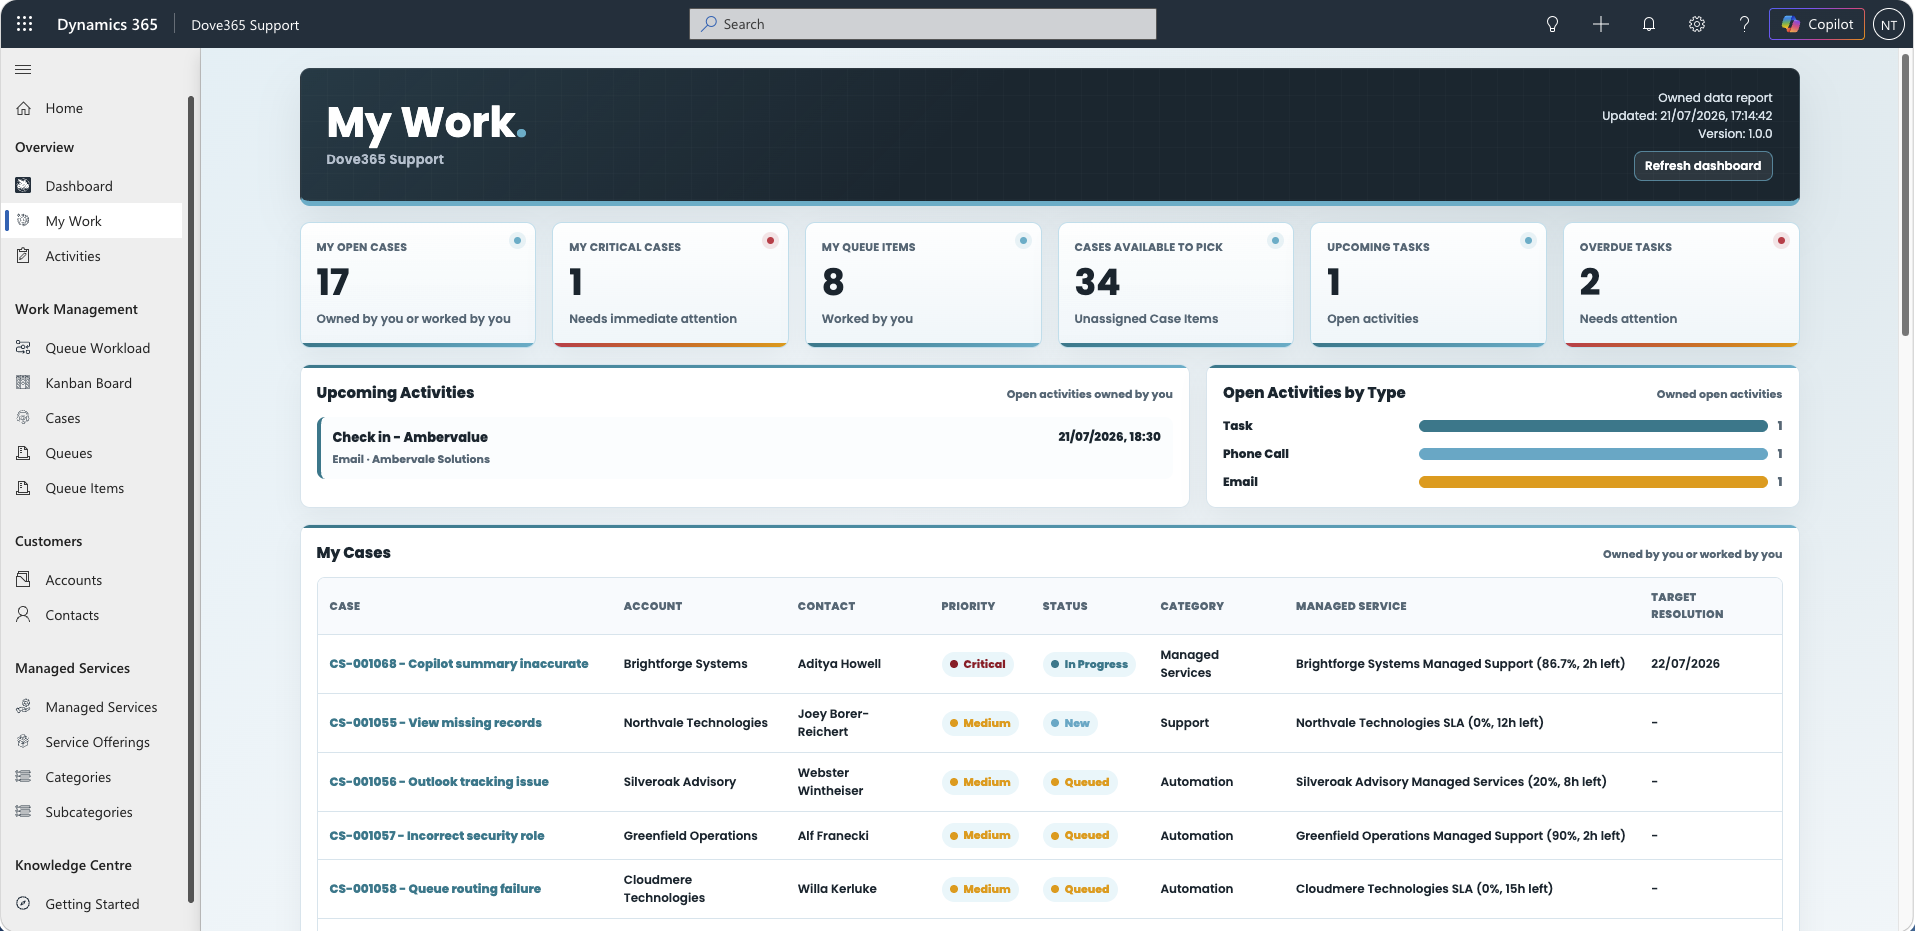
My Support Work Dashboard
Use this dashboard for personal day-to-day work.
It focuses on:
- Cases in your queue.
- Queue Items worked by you.
- Cases available to pick.
- Your upcoming activities.
- Your overdue activities.
- Your Cases requiring attention.
Reading the KPI tiles
Three of the tiles measure different things and are the most common source of confusion:
My Open Casescounts active Cases in your own queue. It is a Case count.My Queue Itemscounts Queue Items whereWorked Byis you, across every queue. It is a Queue Item count.Cases Available to Pickcounts unassigned Queue Items in the configured default queue.
Queue Item counts and Case counts can legitimately differ. A Case can have more than one Queue Item, and you can work items from queues other than your own.
Upcoming Tasks and Overdue Tasks follow the standard CRM My Work labels, but the underlying data is open dated activities you own, not only Task records.
The My Support Work Dashboard has no filter bar. It scopes itself automatically to the signed-in user, their queues, worked queue items, and the default queue.
Dove365 Support Dashboard
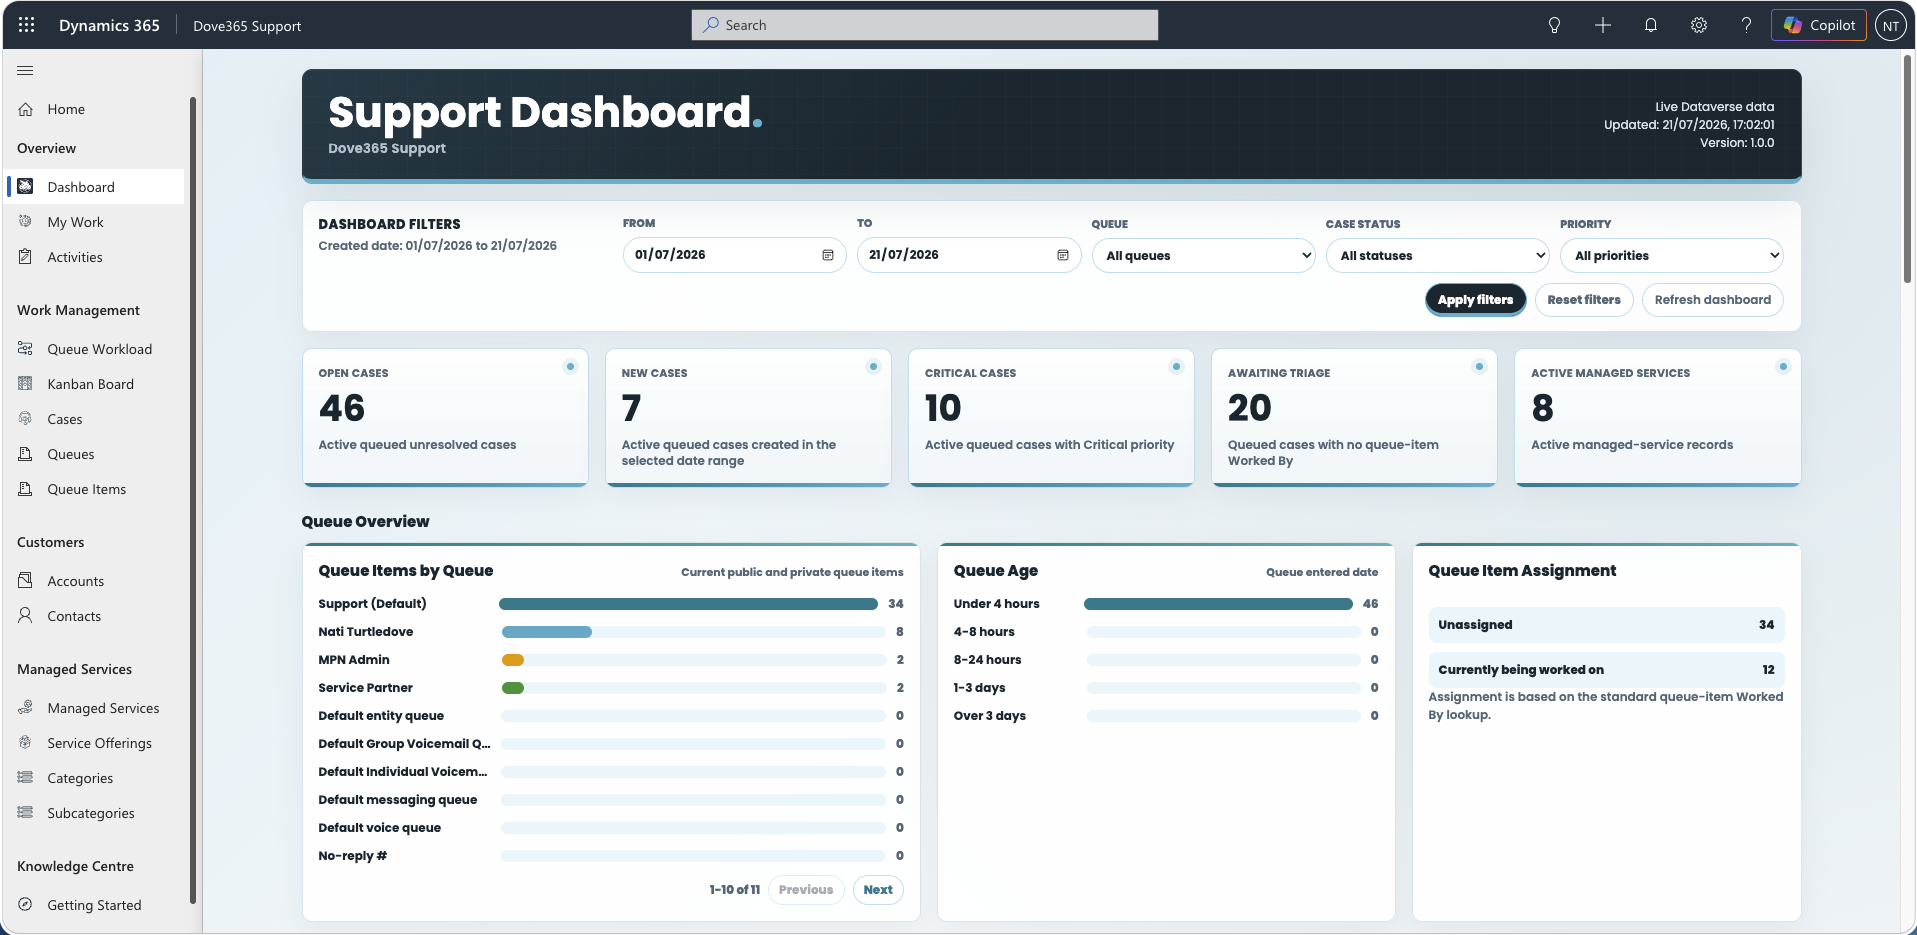
Use this dashboard for operational oversight.
It focuses on:
- Open Cases.
- New Cases.
- Critical Cases.
- Triage volume.
- Queue item distribution.
- Queue age.
- Managed Service utilisation.
- Operational tables.
Filters
The Support Dashboard has a filter bar for date range, queue, case status, and priority. Apply filters reloads the dashboard with the current values, Reset filters returns to the default current-month range and clears the rest, and Refresh dashboard reloads using the values already set.
The date range works on Case created date. Resolved-case trend data uses the resolved date against the same range, so a Case created before the range can still appear in resolved trends.
Status and priority options are populated from the loaded Case data. If a value does not exist in the current result set, it may not appear as a selectable option.
Case and queue visuals
The Support Dashboard groups its visuals into queue overview, case distribution, and volume trends.
Queue overview
- Queue Items by Queue: current queue item volume by queue. The default queue is marked
(Default)whendove365_DefaultQueueGUIDis available. - Queue Age: active queue items bucketed by time in queue — under 4 hours, 4–8 hours, 8–24 hours, 1–3 days, and over 3 days. Review the over-3-days bucket first.
- Queue Item Assignment: split between unassigned items and items that have a
Worked Byuser.
Case distribution
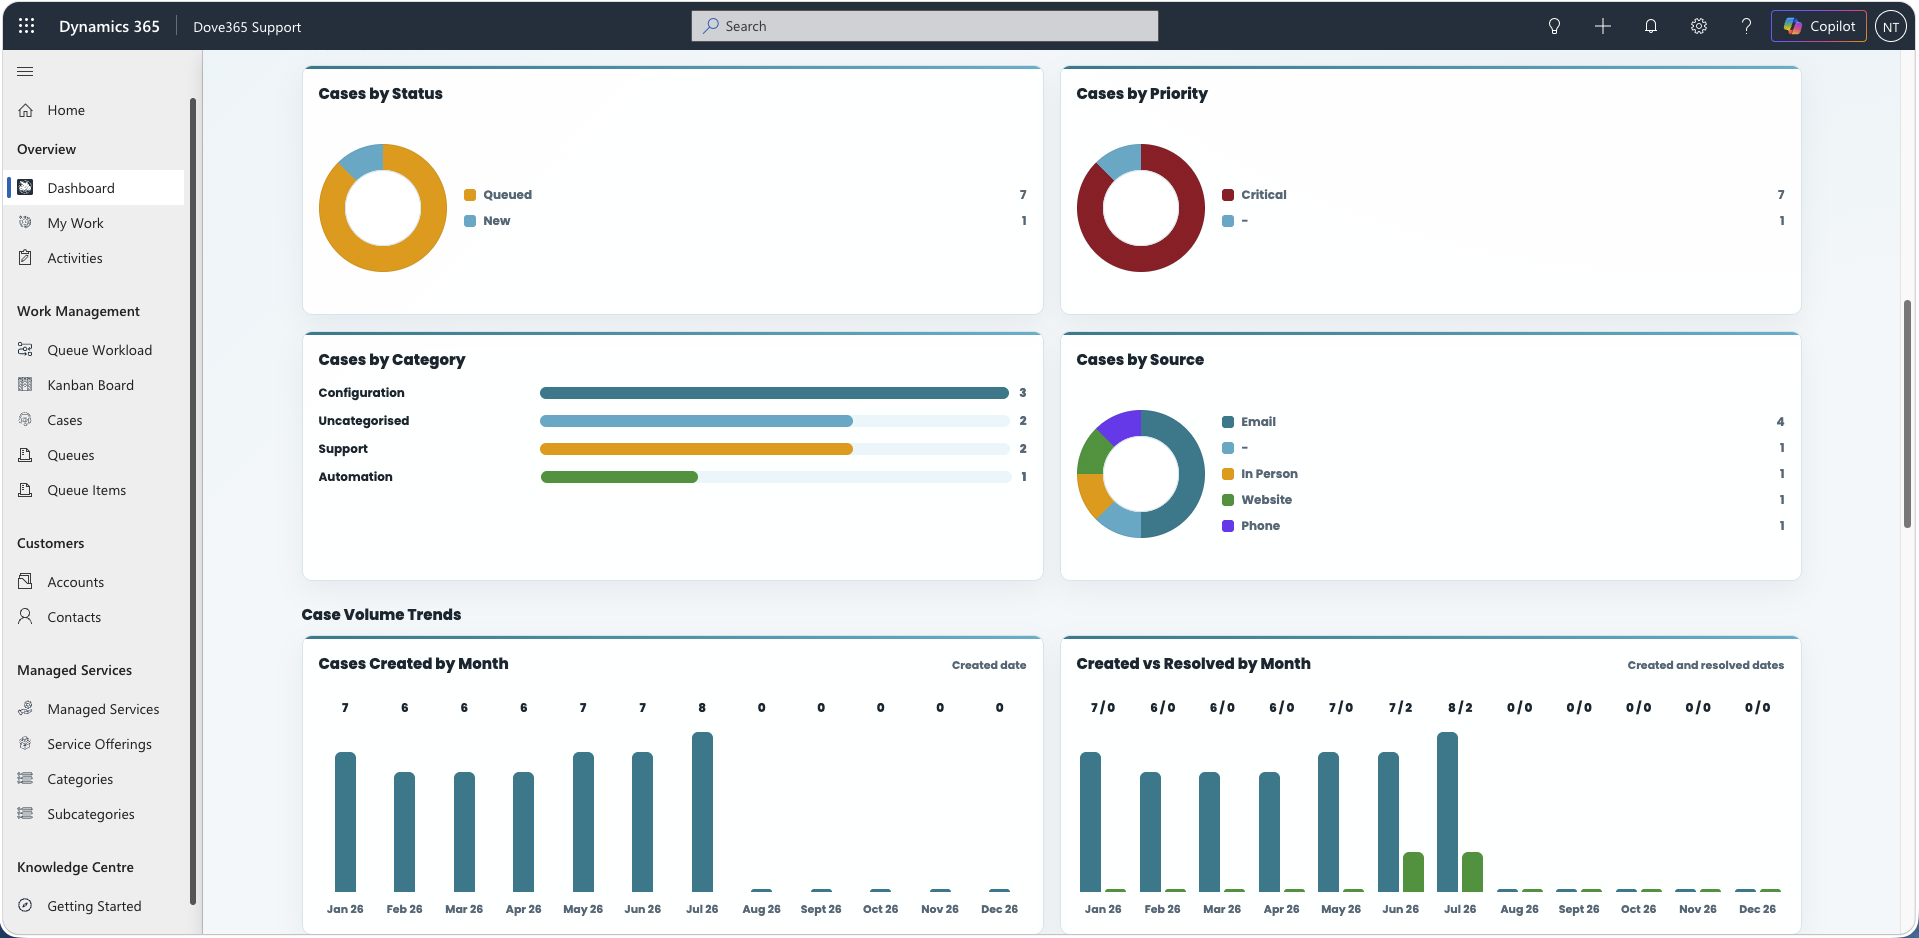
Cases are grouped by status, priority, category, and source. Cases without a category appear as Uncategorised.
Case volume trends
Cases Created by Month shows active Cases created in the selected range. Created vs Resolved by Month compares that against Cases resolved in the same range. If created volume is consistently higher than resolved volume, backlog is increasing.
Managed service utilisation
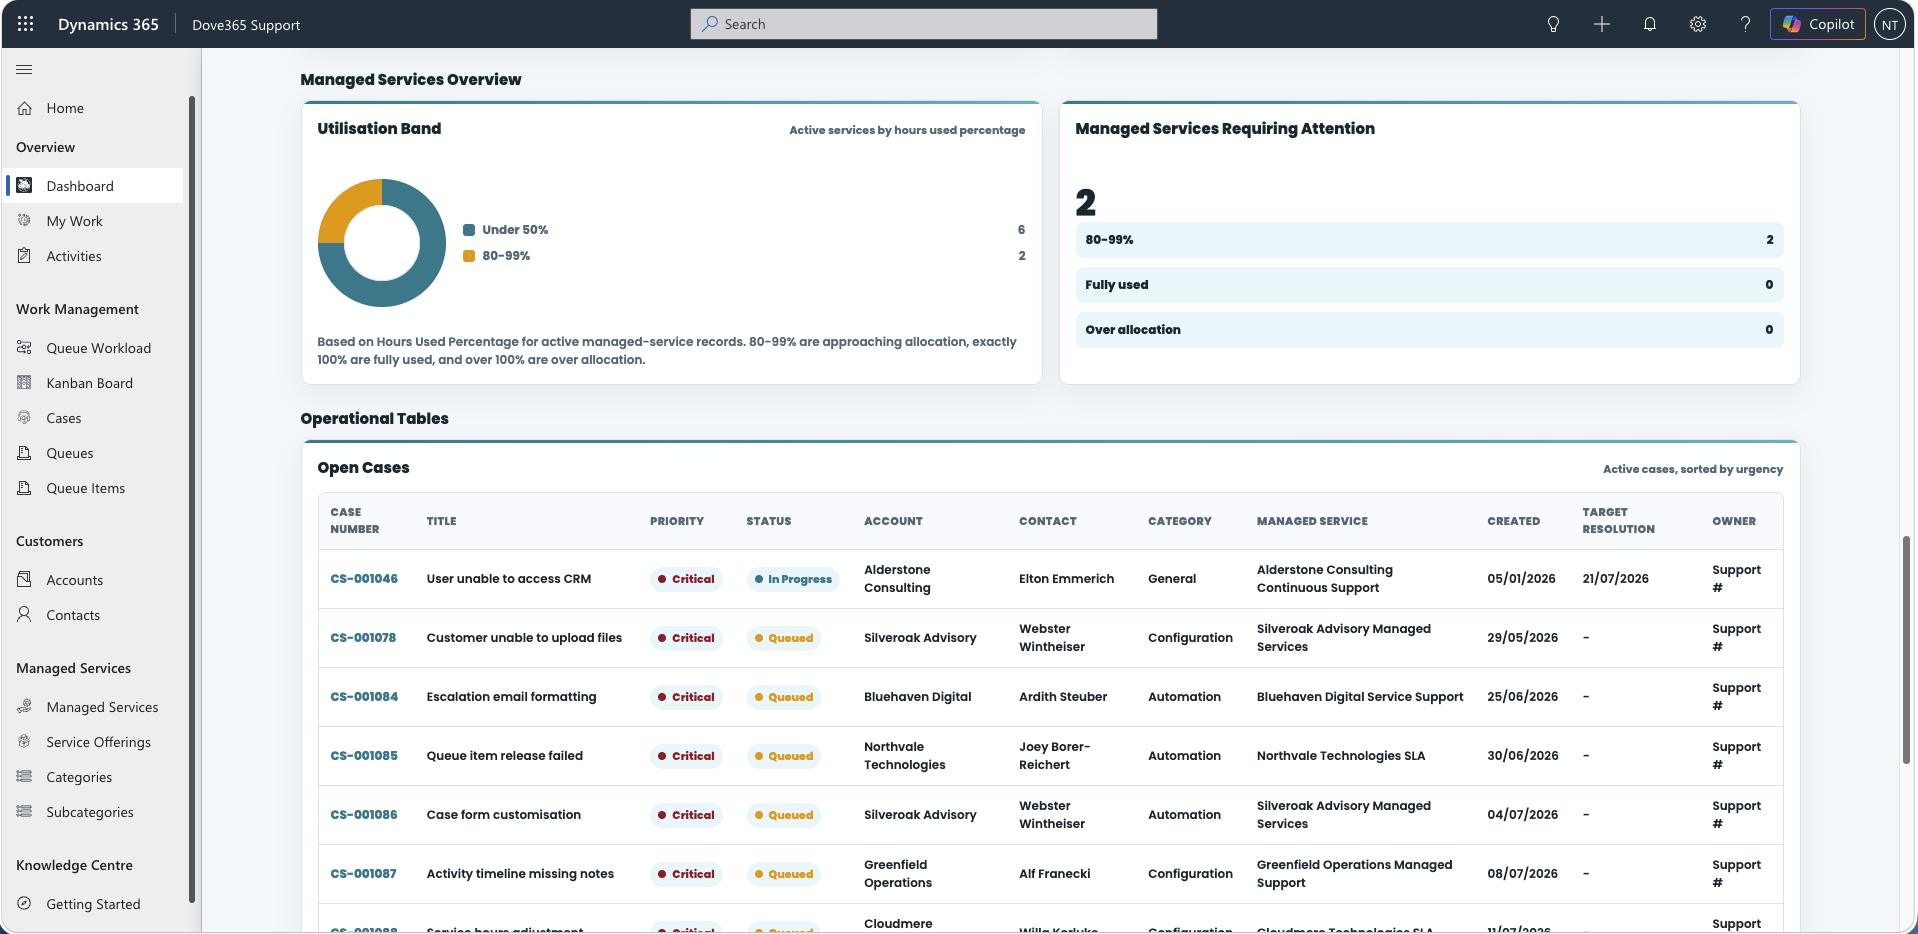
The Support Dashboard groups active Managed Services into utilisation bands: under 50 per cent, 50–79 per cent, 80–99 per cent, exactly 100 per cent, and over 100 per cent.
Managed Services Requiring Attention counts active records at or above 80 per cent utilisation and breaks the total into 80–99 per cent, fully used, and over allocation. Review over-allocation first, fully used next, then use the 80–99 per cent band as an early warning list.
Managed Service records are loaded as active records and are not filtered by the case created-date range. Their utilisation visuals represent current managed service state, not only services related to Cases created in the selected period.
Kanban Board
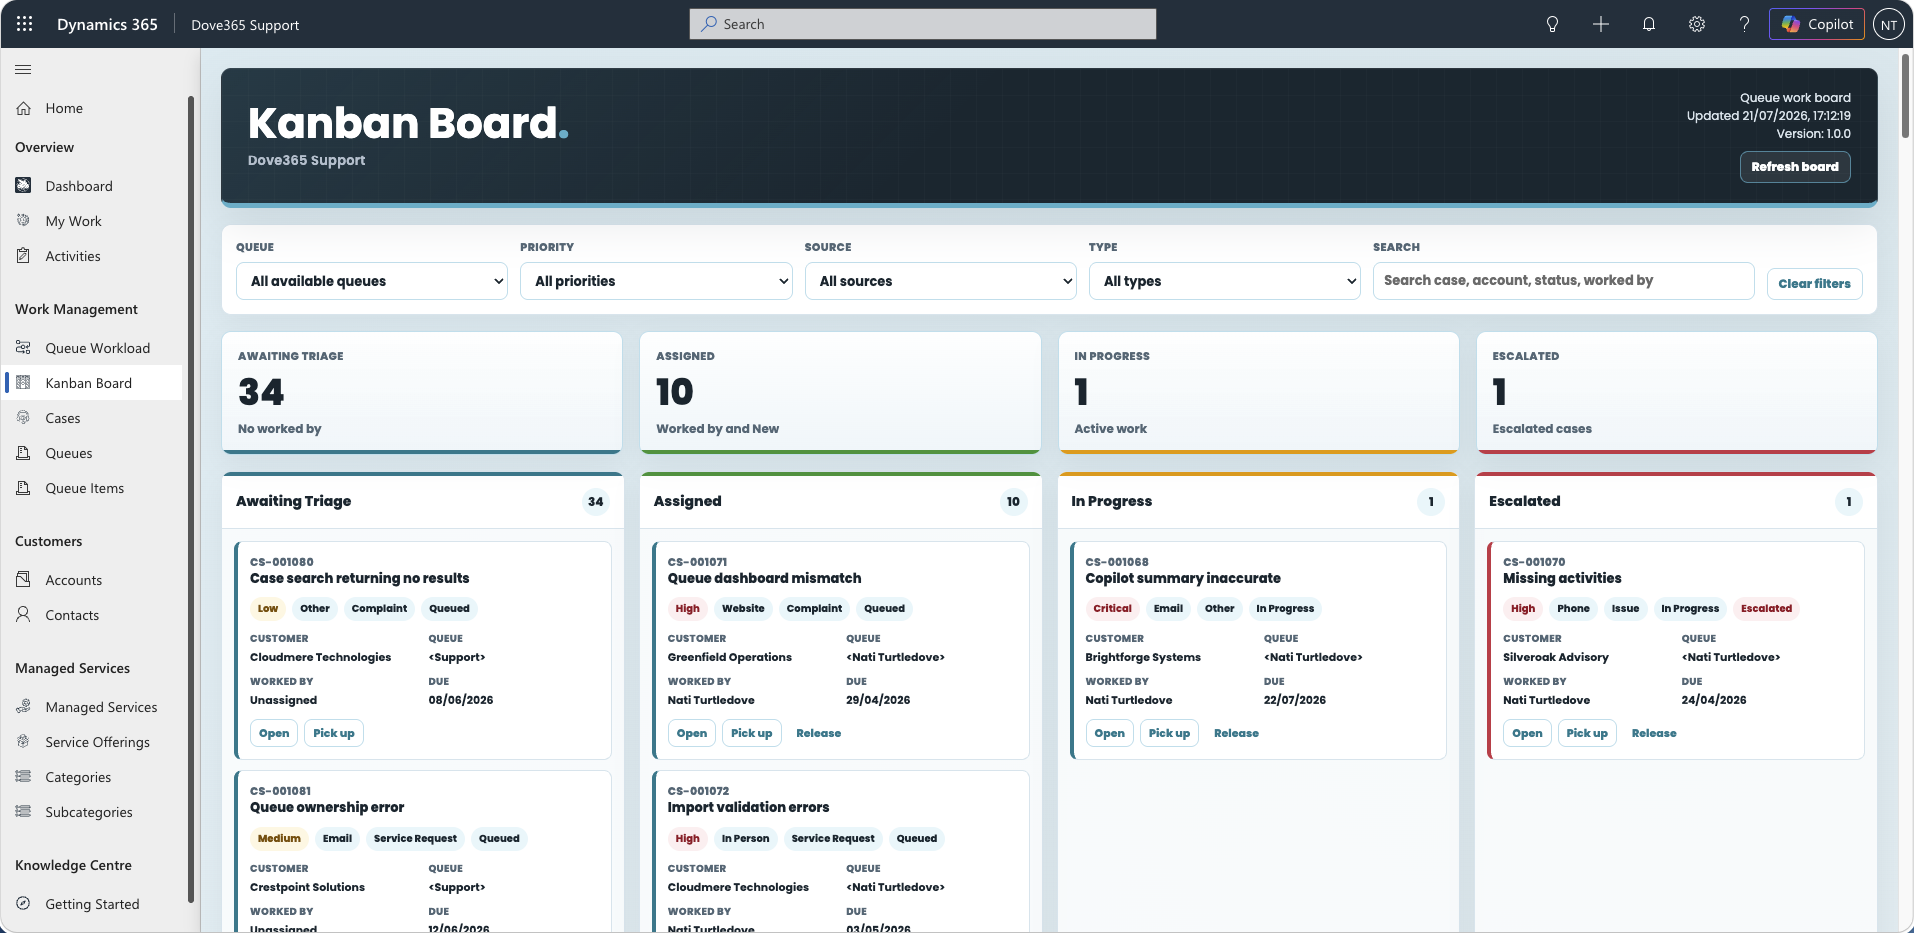
The Kanban Board is an operational queue work page. It shows active Queue Items as Case cards grouped by work state:
- Awaiting Triage.
- Assigned.
- In Progress.
- Escalated.
Filter by queue, priority, source, type, and search text. From the board you can open Cases, pick up work, assign work to Dove365 users, release work back to triage, and escalate Cases to an escalation manager.
Read the Kanban Board guide for the full column rules and troubleshooting.
Queue Workload Board
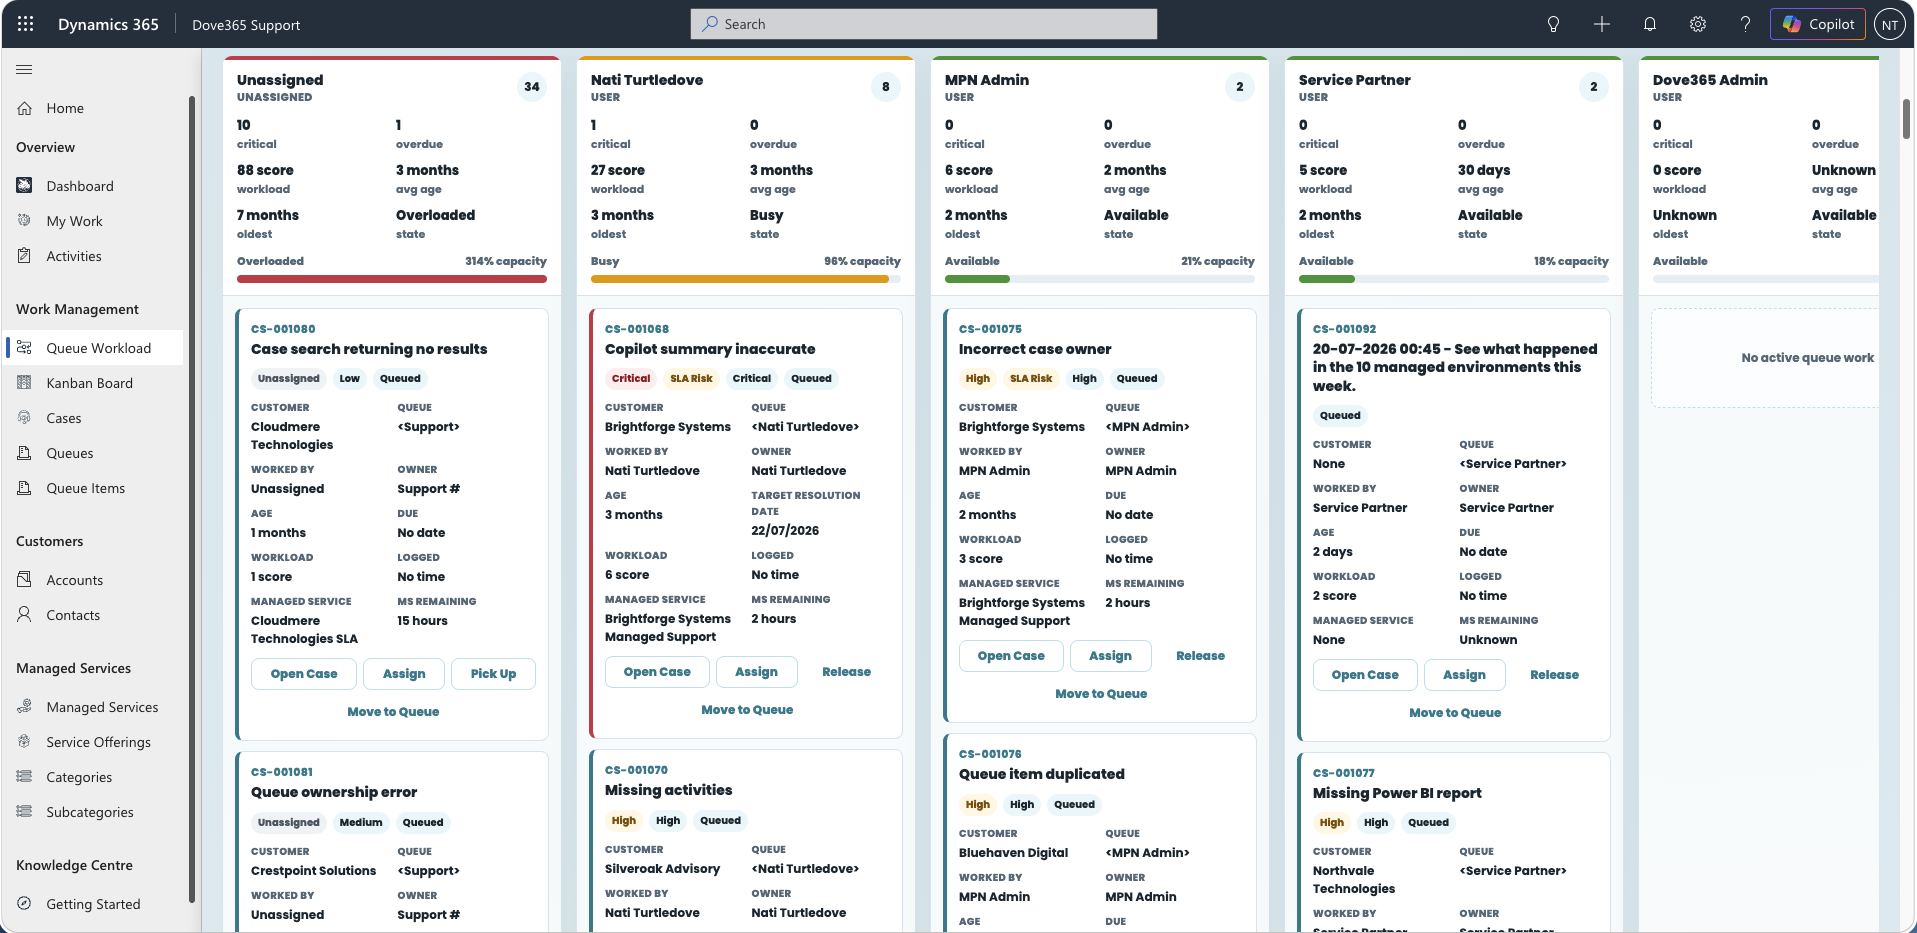
The Queue Workload Board shows the same queue work grouped by who is carrying the load rather than by work state. Use it to see how much each technician has, find spare capacity, and rebalance Cases across users, teams, and queues.
Lanes can be grouped By User, By Team, By Queue, or in Capacity View, which is the default and shows every active user ordered by capacity used. Each lane is measured against a capacity of 28 workload score per user and reported as Available, Healthy, Busy, or Overloaded.
Read the Queue Workload Board guide for the workload scoring method, queue membership requirements, and troubleshooting.
Using dashboards
Recommended daily routine:
- Start with My Support Work Dashboard.
- Review overdue activities.
- Review Queue Items worked by you.
- Pick available work if appropriate.
- Review Cases requiring attention.
- Use the Kanban Board to assign, progress, release, or escalate queue work.
- Use the Queue Workload Board to rebalance work when someone is overloaded.
- Use the Support Dashboard for wider team context.
Troubleshooting dashboard results
If results do not match expectations:
- Confirm you are in the Dove365 Support app.
- Confirm security roles.
- Confirm Queue Items have the correct
Worked Byvalue. - Confirm Cases are active and unresolved.
- Confirm the default queue GUID is configured.
- Confirm dashboard filters on the organisation-wide dashboard.
- Refresh the dashboard.
- Open the browser console and check the dashboard diagnostics.
If a number looks lower than expected, check whether the missing records are inactive. Active case and managed service queries exclude inactive records.
Continue learning
Daily Support Workflow
Use dashboards as the starting point for the day-to-day support flow.
Kanban Board
Pick up, assign, progress, release, and escalate queue work by support state.
Queue Workload Board
See who is carrying how much work and rebalance across users, teams, and queues.
Need help with Dove365 Support configuration?
Book a free call and get your questions answered directly by Dove365.